

Lee Rozeboom, Vice President and Managing Director of Sales at GreatAmerica, and Peter Kujawa, VP & GM of Service Leadership, Inc.®, a ConnectWise solution hosted the second of a series of three webinars discussing best practices for compensation plans – and how to create compensation plans that are mutually beneficial to your company and your team.
To watch the recorded version of this webinar, please visit here:

Compensation Best Practices of the Top Performers
This blog provides a summary of the webinar above – so let’s dive in!
Managed services industry overview
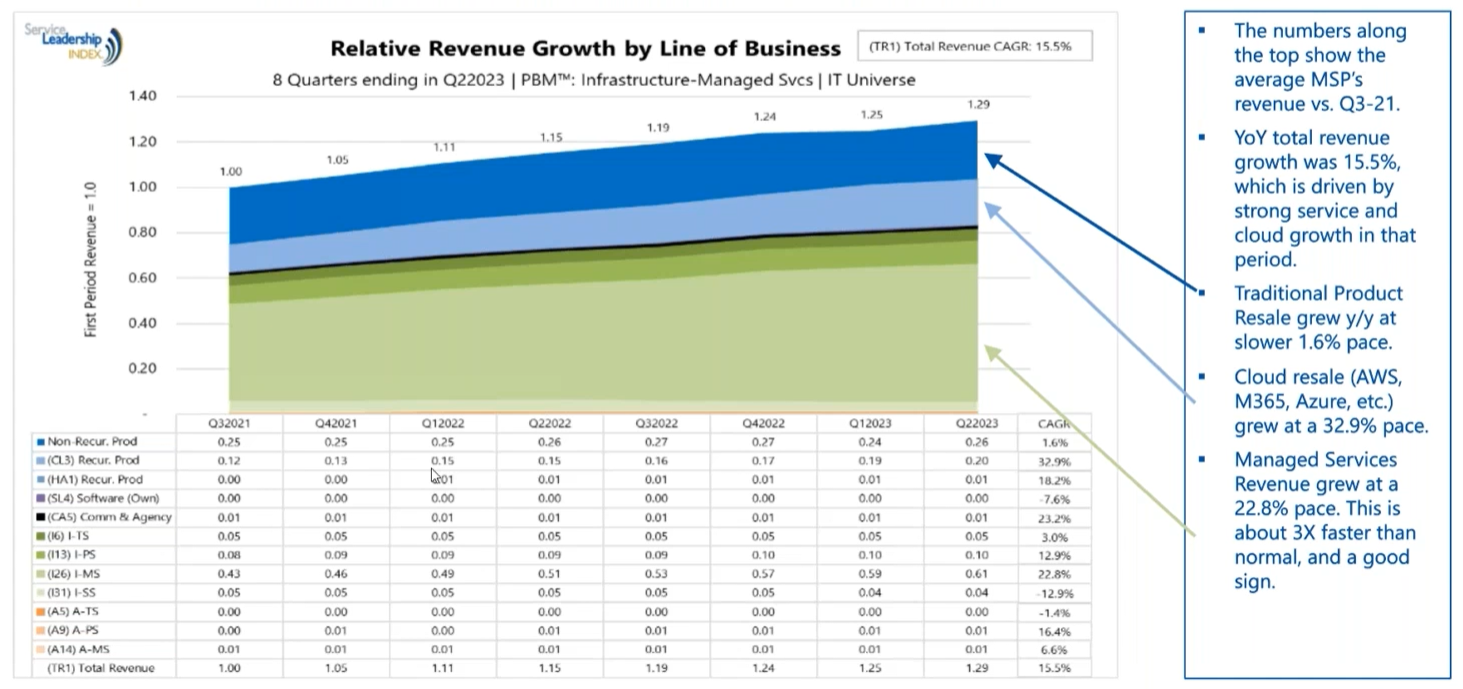
Overall, the state of the industry is good according to Service Leadership. In Q1 2023 MSPs grew, but at a much slower pace than historically. However, in Q2 MSPs bounced back and the industry itself is looking like it’s headed towards another rock-solid year after three good years in a row. As indicated in the graph below, the year-over-year growth for MSPs was 15.5% which is a little better than normal. Overall, managed services revenue growth was at a 22.8% pace which is about 3x faster than normal – and a very good sign for the industry.
The importance of Operational Maturity Levels
Determining your Operational Maturity Level™ (OML™) is a term Service Leadership created that is a means of measuring how well run your business is.
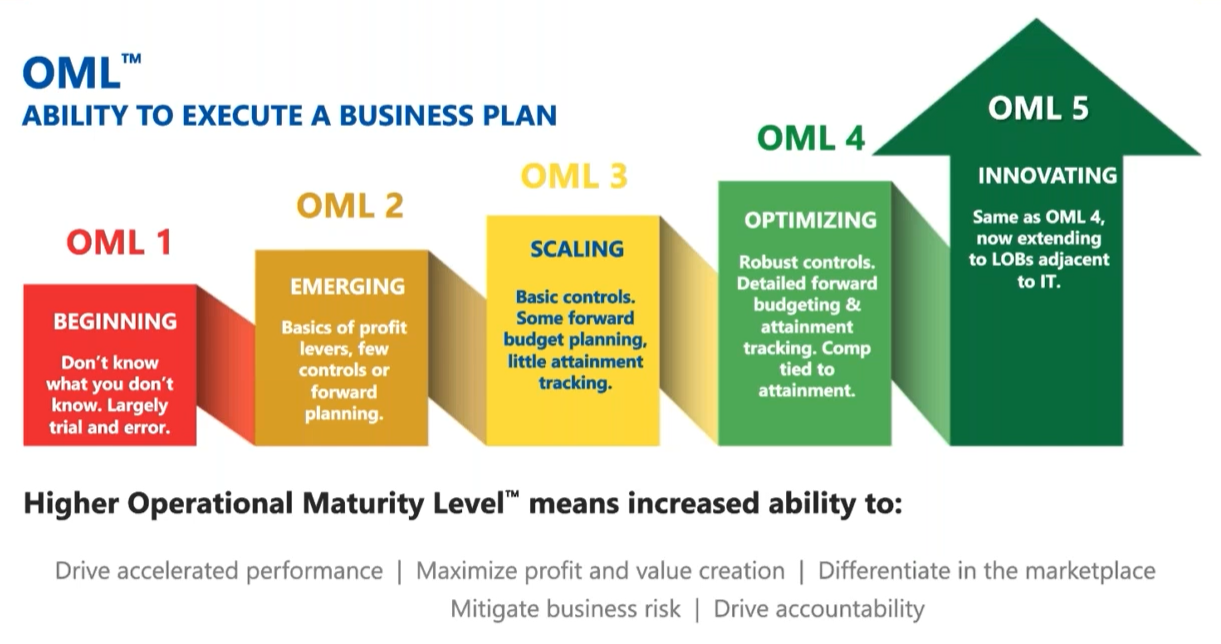
There is a strong positive correlation between OML and EBITDA. MSPs at OML 5 experience about 2x higher profitability compared to OML 3 and nearly 4x to OML 1. Additionally, they experience about 10% higher overall gross margin and over 13% on managed services Gross Margin % (GM%). This is a result of maintaining discipline in enforcing the standardization of technology stacks, which leads to an overall more efficient service quality and profitability.
Even the small improvement of moving to OML 2 from OML 1 has a significant impact in increasing managed services GM% by around 10%. So, how does the design and implementation of compensation plans play into a higher OML score?
Related: take the OML assessment to see how your business is performing!
The Best-in-Class pay less incentive pay than the median and bottom quartile
That’s right – the most profitable solution providers are paying less TAE (total annual earnings) for staff. How are they doing this? One of the ways is to have a narrower target customer profile that will allow you to have a more streamlined technology stack. This enables you to hire lower-cost employees and facilitate cross-coverage of tasks to drive higher utilization. The Best-in-Class prioritize hiring, training, and mentoring for Level 1 employees and continuously source new talent.
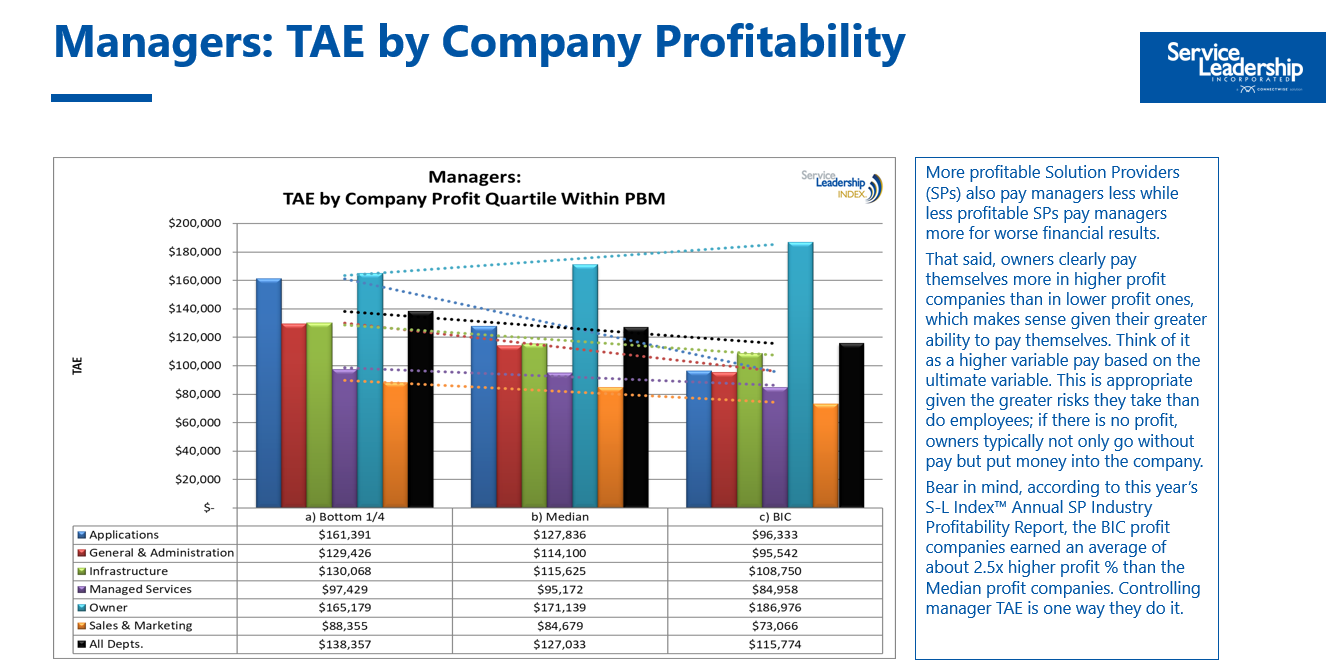
The same correlation between TAE and company profitability applies to management positions. More profitable Solution Providers pay managers less on average, while less profitable Solution Providers pay more. That said, owners clearly pay themselves more in higher profit companies than in lower profit ones (as you can see in the chart below), which makes sense given their greater ability to pay themselves. Think of it as a higher variable pay based on the ultimate variable. This is appropriate given the greater risks they take than employees do; if there is no profit, owners typically not only go without pay but put money into the company.
Does this mean Best-in-Class always pay less?
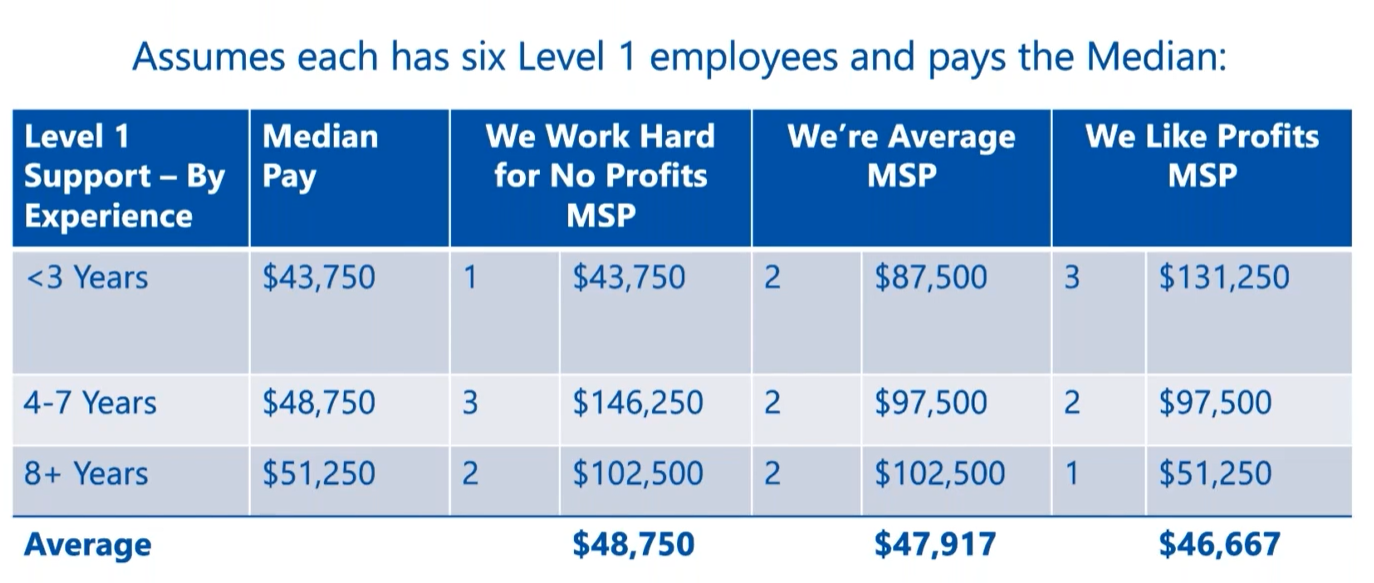
No! It simply means that, on average, the Best-in-Class pay the least for comparable positions and the bottom quartile pay the most. Below is an example of how this might look. All are paying the same median pay, the difference is if you staff for these six positions in these equivalent MSPs and in this manner, the bottom quartile is paying on average $48,750 while the top quartile is paying $46,667. It’s like positions, but a difference in how they are paying.
The recipe for MSP success
TCP + Technology Standards + Cross Selling Effectiveness
=
Easier to replace with lower skill, lower priced tech talent
In order to outperform your competition, you need to pursue a narrow enough size range of customers that you need to only build one Service Factory™ and Sales Factory™. When every sale uses the same factories, they will be highly utilized and efficient.
Get new customers on board with as much of your offering right away and keep them on it with upgrades synchronized across the contract base. A great way to synchronize upgrades is with technology financing and technology integrations; both of which GreatAmerica Financial Services can help you make a part of your sales process. And finally, 100% of your customers should buy 100% of your offering, meaning as many customers as possible purchase your best package from day one.
MSPs with high scoring OML scores have a deep and well-defined tech stack. This tech stack will typically include all technology that they will need to manage and includes robust security. When onboarding a new customer, any other technology that isn’t a part of this tech stack is removed and/or replaced – and this is non-negotiable.
The Best-in-Class tie more TAE to incentive pay
More profitable Service Providers make greater use of variable pay for staff. Variable pay for junior technical staff should be around 10% of TAE and for senior technical staff; it should be around 20% of TAE. The same is true for managers – variable pay for managers should be 20-40% of TAE depending on the management role.
According to the Service Leadership Index® 2023 IT Solution Provider Industry Profitability Report™, the Best-in-Class profit companies earned an average of about 2.6x higher profit % than the median profit companies. Incentive compensation is one way they do it.
Here are some important questions to answer when designing your compensation plans:
- How much should you pay your people (target at 100% performance)?
- How much of that should be salary and how much of that should be incentive?
- What should the incentive be based on to drive the desired behavior? What metrics?
- What amount of leverage, what measurement periods?
Rules for incentive plan design
To motivate employees, the incentive plan must meet several requirements:
1. Fair – pays the same proportion of available incentive to me as to my peer, if we both put in the same performance.
2. Influence – I can influence the outcomes which affect my incentive payment. What I do actually does impact the factor being measured.
3. Measurable – what you are paying me for, is actually something you can accurately measure.
4. Attainable – I believe I can (if I stretch) actually perform to the level that will earn me some/all incentive pay.5. Understandable – I believe I can (if I stretch) actually perform to the level that will earn me some/all incentive pay.
6. Top performance – with great performance, I can surpass market compensation.
The plans must also create these same incentive plan wins for the company:
1. Affordability – the company can afford it.2. Behavior – the incentive plan drives behavior which supports company goals.
3. Incentive objectives – feeds the eagles, scares off the turkeys.
4. Top performance – with great performance, star performers can surpass market compensation.
5. “At plan” performance – pays market or perhaps 1% or 2% above market.
6. Bottom performance – the company is protected more and more if performance is below a series of thresholds.
7. Ease of administration – the incentive plan is easily calculable and payable from a payroll processing standpoint.
How to effectively implement these compensation plans
At the core of all these plans and strategies are the people – and these plans and strategies don’t work without amazing people and an amazing culture.
“Our Greatest asset, our only true differentiator is our people. Our competitors can copy what we do, but they don’t have the best… We do.”
– Tony Golobic, Executive Chairman at GreatAmerica Financial Services

Culture requires continual work. If you’re not moving forward, you’re falling behind. If you are interested in curating a wonderful culture that your competitors will envy, visit PathShare, a GreatAmerica company, that specializes in HR Services for GreatAmerica Customers. And please join us for the third and final part of this webinar series taking place Thursday, October 26 at 1 p.m. CT.